Solar InSight / The Latest Solar News from PV Intel
The US Department of Energy’s Energy Information Administration (EIA) released its most recent Electric Power Monthly update, which provides data through the end of May. The report notes that for the month, solar photovoltaic generation (solar1) as a portion of all electricity grew 21.35% over May of last year. Solar accounted for just over 7.24% of total US electricity generated for the month versus 5.97% last year.
Total US electricity use for the month – 296,423 GWh – decreased by 3.77%. For the year through the end of May, total U.S. electricity usage is down 2.96% versus last year.
Solar produced 15.98% more of all electricity so far this year versus the same period of 2022, covering 5.46% of all US electricity generated for 2023..
Per the EIA, small scale solar was 2.26% of all generation, while utility scale generation was 4.98%. As always, this percentage varies quite a bit by state.
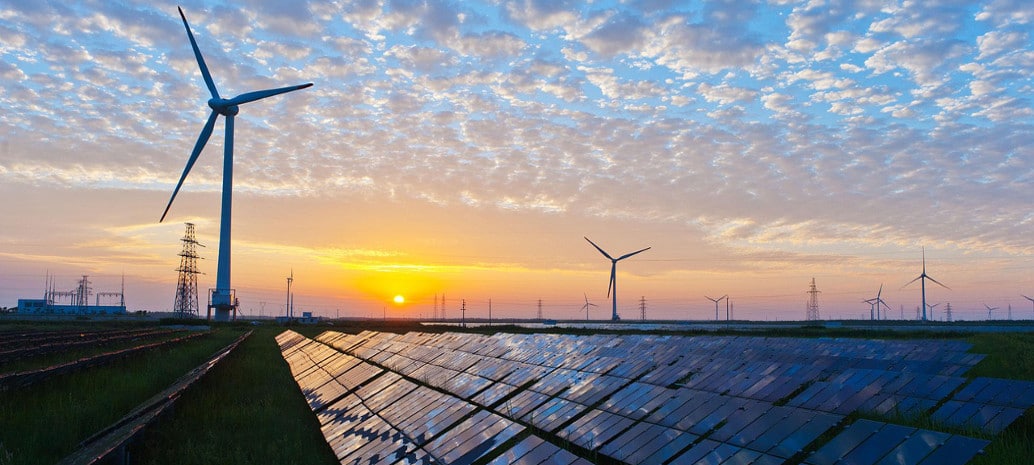
The dynamic duo of wind and solar generated 16.79% of electricity for the month, up -6.37% from last year – and so far covering 17.64% of all electricity generated year to date.
Total emission-free generation2 (composed of nuclear, wind, hydroelectric, solar PV, and solar thermal) for the month was 43.55%. Nuclear led all emission-free generation resources at 18.33% of all electricity. Wind power was 9.55% and hydroelectric was 8.34%.
In absolute terms, total emission-free generation is down 2.13% versus last year. Year to date, total emission-free sources generated 43.31% of all electricity.
1 PV Intel notes the difference between the two major categories of solar energy technologies. Solar thermal technologies are very different from other kinds of solar technologies in the way that they produce electricity. The EIA simply tracks solar thermal and solar photovoltaics for the purposes of electricity generation. We note this difference not only for the technical distinction between these technologies, but also to recognize how these different approaches to producing electricity from the sun appropriately fit into the energy transition.
In terms of electricity, solar thermal generation has been flat or negative for many years and there are no solar thermal projects planned to be built in the foreseeable future in the United States. Solar thermal generation is a very small segment that isn’t growing at all and thus is a statistical ‘drag’ on the broader category of solar generation overall. Again, we make this distinction because PV Intel is primarily focused on the growth of solar photovoltaics, thus the “PV” in our name. We do account for solar thermal in the emission-free generation category, for comparison with the other renewable energy technologies.
2 PV Intel makes a distinction in our reporting between “renewable” energy and “emission-free” energy. Both categories differ from definitions of “sustainable” energy, of which there are many. For example, we exclude biomass from the emission-free category. This includes sources such as waste-to-energy methane from landfills, wood and wood waste, municipal solid waste, landfill gas and biogas. Such biofuels may be renewable but still account for greenhouse gas (GHG) emissions when used to produce electricity. Provisionally, we do include nuclear in our emission-free category, though we also recognize that this source is problematic in other ways. See MIT’s excellent explainer for more on renewable vs. carbon-free energy.


