The US Department of Energy’s Energy Information Administration (EIA) released its most recent Electric Power Monthly update, which provides data through the end of July. The report notes that for the month, solar photovoltaic generation (solar1) as a portion of all...
The US Department of Energy’s Energy Information Administration (EIA) released its most recent Electric Power Monthly update, which provides data through the end of June. The report notes that for the month, solar photovoltaic generation (solar1) as a portion of all...
The US Department of Energy’s Energy Information Administration (EIA) released its most recent Electric Power Monthly update, which provides data through the end of May. The report notes that for the month, solar photovoltaic generation (solar1) as a portion of all...
New Solar Development Training by PV Intel teaches users how to develop community scale solar projects. The United States is projected to double the total amount of installed solar PV by the end of 2025. Annual deployments are growing by over 500% and will reach 100...
This table represents the top 25 largest solar projects in the United States in terms of nameplate capacity (MW), as reportedby the Energy Information Administration. Projects must have received regulatory approval, but not yet achieved commercial operation date. A...
Solar InSight / The Latest Solar News from PV Intel
More than half of all US generation was emissions-free for 10% of this year
Solar, wind, hydropower, and nuclear exceeded 50% of all electricity generation in the United States for 10% of the hours reported by the Energy Information Administration in 2022 through May. Plus, what role do hydropower and nuclear serve going forward?
Guzman Labs
Emissions-free electricity generation is expanding at stunning rates across the United States, largely due to the dawn of the solar and wind energy decade. Based on the Energy Information Administration (EIA) hourly data reports, the combined forces of solar, wind, hydropower, nuclear energy, and solar thermal energy generated more than half of all US electricity for 10% of the hours reported thus far in 2022.
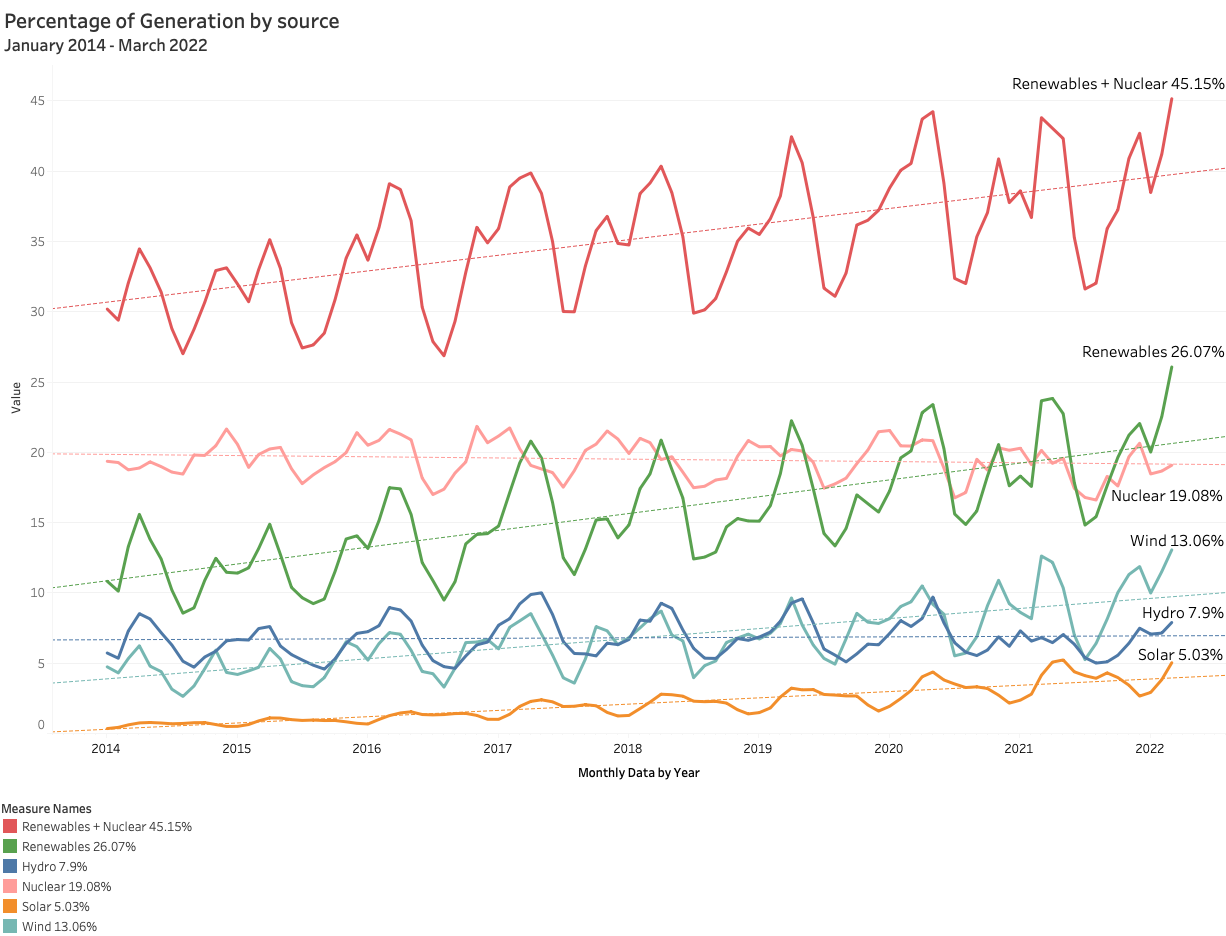
This is remarkable progress considering not long ago in 2014, solar had a negligible impact on the energy mix, and emissions-free power represented roughly 30% of the energy mix. Now, for the month of March, it supplied 45% of US electricity. We can expect that number to reach even higher over the next two to three months, where solar, wind, and hydropower begin to ramp up production, and decreased demand leads to a reduction in gas-powered peaker plants firing up.
Solar electricity is increasingly making its mark. In 2014, it was less than 1% of the mix. But this year through March, it contributed 5.03% of total electricity generation. Based on the EIA near-term outlook, solar is 48% of the planned capacity additions over the next two years. Solar and battery storage combine for 60% of capacity additions over the two-year horizon.
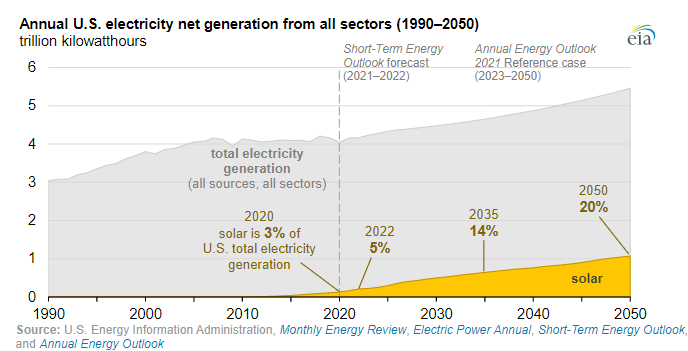
This growth and contribution to the grid is right in line with EIA’s late 2021 projections, which pegs solar as a 5% contributor to total generation in 2022, 14% by 2035, and 20% or more by 2050. This includes both utility-scale and small-scale distributed solar generation.
Image: Energy Information Administration
Through the first quarter, solar generated 28.5 TWh, up from 20.9 TWh in the first quarter the year prior. That is a solid growth of 36% year over year for solar generation.
For the first quarter year-over-year, emissions-free power, including nuclear, grew 15%. Over the same period, wind generation grew 23%, hydropower increased 6.85%, and nuclear fell by 5.61%.
Image: PV intel
The growth in hydropower was largely due to 2021 being a drought year rather than new capacity additions. Nuclear power has not made any significant capacity additions, and several retirements are expected going forward.
Why solar, and not nuclear and hydropower?
This data begs the question: what about nuclear and hydropower? If the United States has goals to decarbonize the grid, why do trend lines show nuclear and hydropower in a flatline or decreasing, while solar and wind are ramping up? And why is solar power 50% of planned capacity additions over the next two years?
A few reasons are cost, project time, and some external problems related to hydropower and nuclear energy. Solar is fast becoming one of the cheapest sources of energy, and it’s relatively easy to deploy. It doesn’t require massive amounts of startup capital compared to nuclear power plants or hydropower dams. Nuclear plants and hydropower dams can have project times in excess of 30 years, and given a climate-driven need to decarbonize rapidly, the United States can’t afford to wait for these projects to go through. It makes them less bankable than a quick turnaround on a utility-scale solar project.
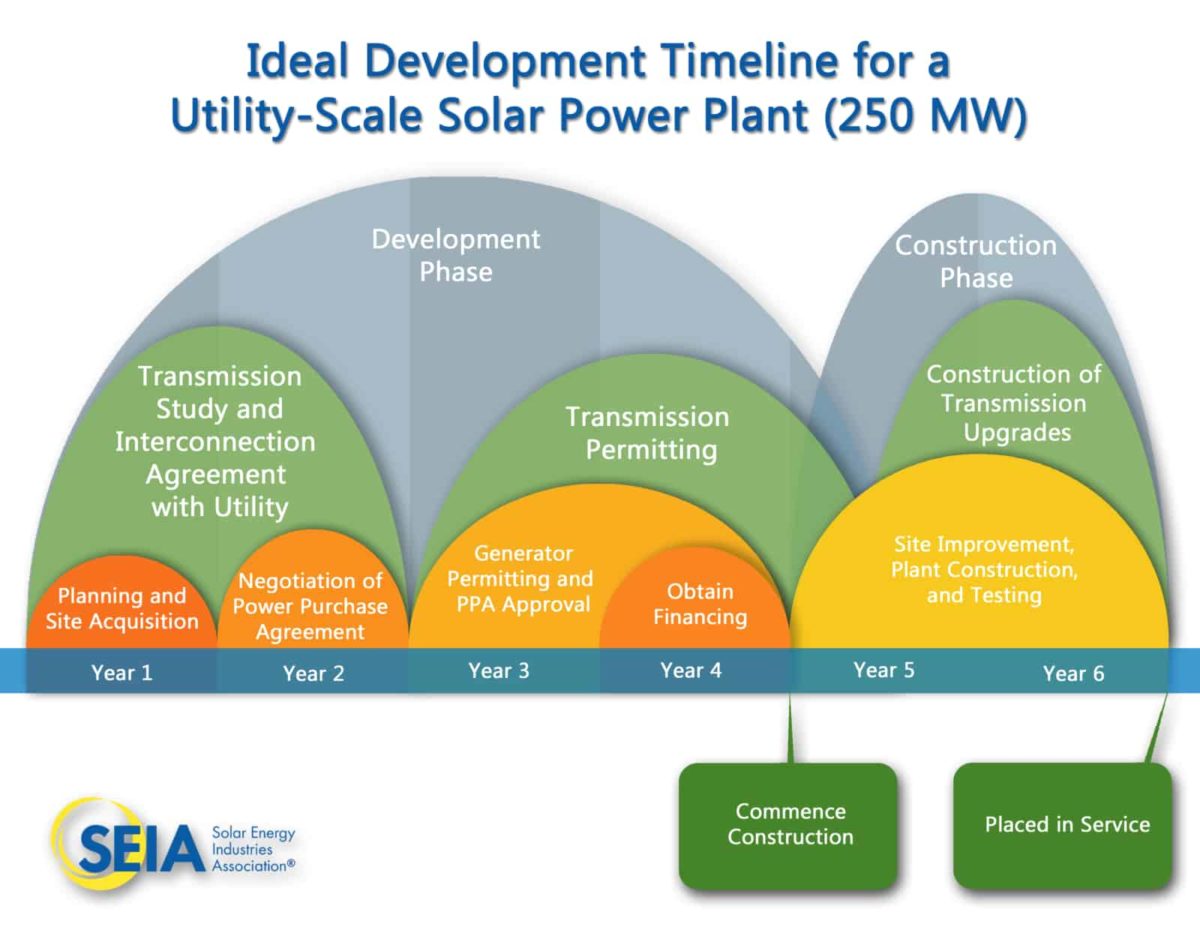
Image: SEIA
The Solar Energy Industries Association indicates that even the largest utility-scale solar projects in excess of 250 MW can take about 6 years to complete, from planning and site acquisition through the date of commercial operations. This makes solar a more attractive prospect to early stakeholders and developers.
Solar may continue to speed up its processes too, as the Department of Energy is exploring ways to streamline permits, lower soft costs, improve interconnection queue times, and encourage solar innovation. With long-term industrial policy like the provision introduced in the Biden infrastructure bill and the possibility of a long-term extension of the solar investment tax credit, the bankability of solar may continue to improve.
It is likely that renewable energy generation declines will cause solar and wind to play an even larger role than expected.
FERC data for projects through 2025 suggest that nuclear’s share in generation may decline from 8.2% to 7.9%, suggesting that it is not a significant part of procurement plans going forward. Nuclear power plants are unpopular with many in the public due to its production of radioactive waste.
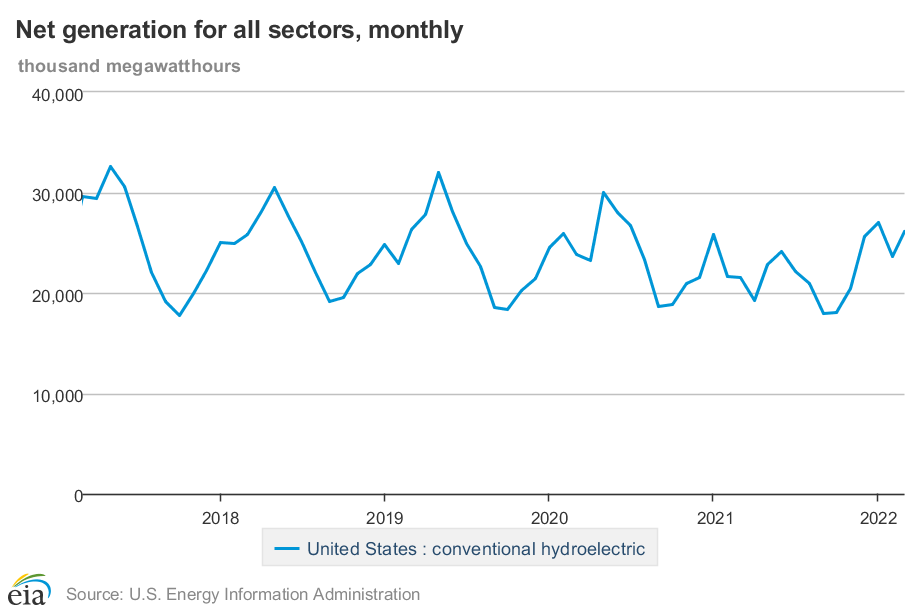
Hydroelectric power is running into some issues, too. Declining water levels, especially in the rapidly drying western United States, are causing production challenges.
Image: Energy Information Administration
As reservoirs dry up, a phenomenon known as a vortex formation can occur, where a tornado-like structure forms in the water. This can cause a number of issues, like decreasing turbine efficiency and increasing vibration, increasing hydraulic losses at the intakes, pulling debris into the system that may block trash tracks, and injecting air into the power tunnel, thereby reducing the longevity of the hydroelectric dam.
Hydroelectric dams come with their own environmental baggage, too. While hydropower does not directly emit air pollutants, it can have harsh impacts on water. Fish migration, water temperature, water chemistry, river flow characteristics, and silt loads can all be shifted by dams. All of these changes have effects on the ecology and physical effects of the river biome supporting the dam.
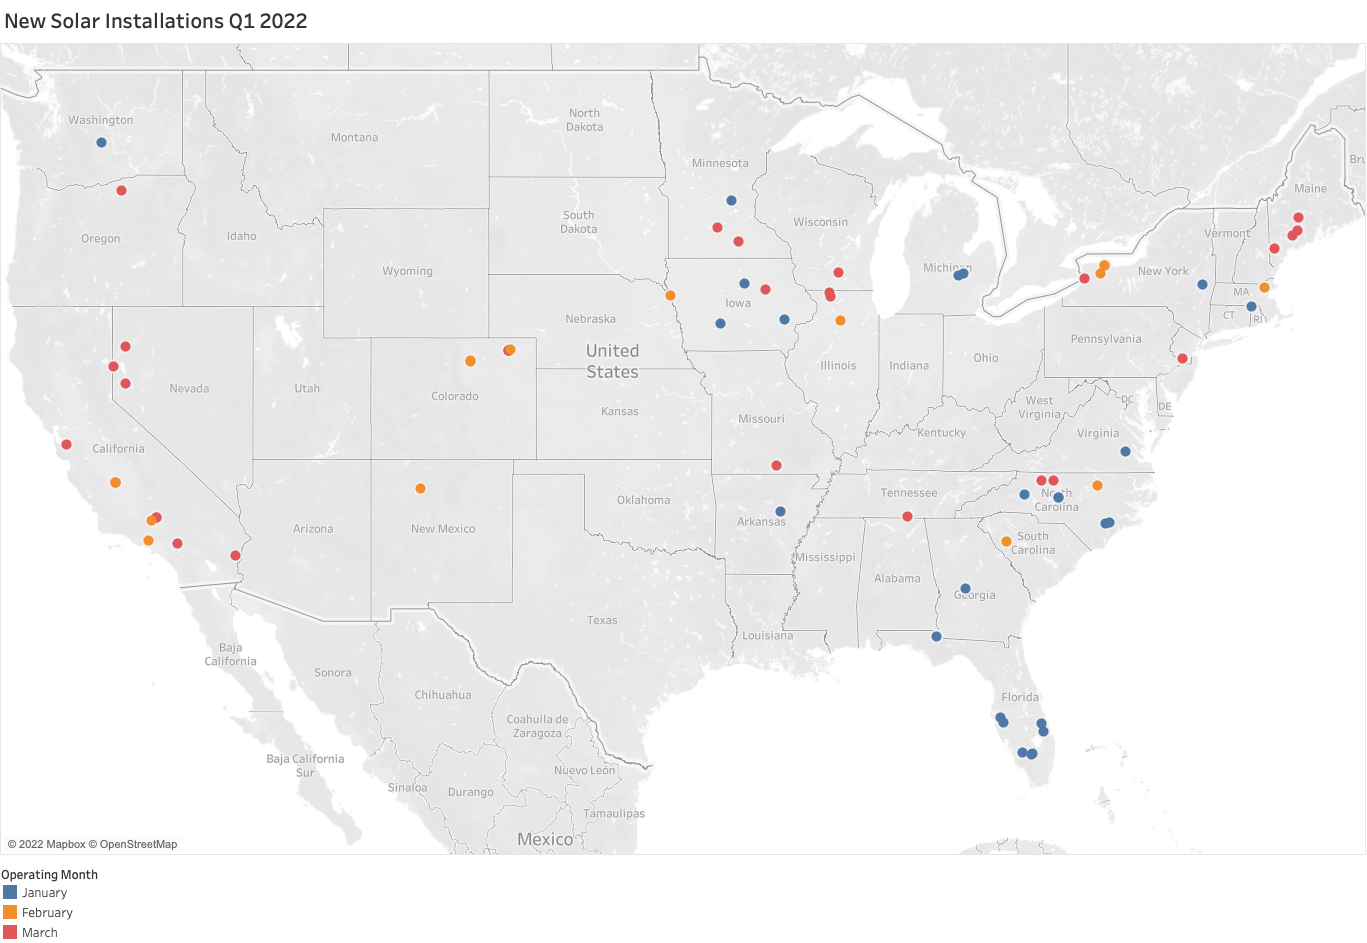
Recent solar projects
Solar is carrying the torch for the energy transition. Below is a map of the installations through the first quarter of 2022, as well as a comprehensive list of the locations of the projects, the project developers, and the capacities of these projects. pv magazine and PV intel will continue to report these new projects on a monthly basis.
Image: PV intel Image: PV intel
Jason O’Leary, Principal Analyst at pv-intel.com, contributed to this article with data analysis and data visualization.
Solar InSight
Solar InSight brings you the latest and most important solar industry news with unique perspective and in-depth analysis by PV Intel.
The US Department of Energy’s Energy Information Administration (EIA) released its most recent Electric Power Monthly update, which provides data through the end of July. The report notes that for the month, solar photovoltaic generation (solar1) as a portion of all...
The US Department of Energy’s Energy Information Administration (EIA) released its most recent Electric Power Monthly update, which provides data through the end of June. The report notes that for the month, solar photovoltaic generation (solar1) as a portion of all...
The US Department of Energy’s Energy Information Administration (EIA) released its most recent Electric Power Monthly update, which provides data through the end of May. The report notes that for the month, solar photovoltaic generation (solar1) as a portion of all...
New Solar Development Training by PV Intel teaches users how to develop community scale solar projects. The United States is projected to double the total amount of installed solar PV by the end of 2025. Annual deployments are growing by over 500% and will reach 100...
This table represents the top 25 largest solar projects in the United States in terms of nameplate capacity (MW), as reportedby the Energy Information Administration. Projects must have received regulatory approval, but not yet achieved commercial operation date. A...