The US Department of Energy’s Energy Information Administration (EIA) released its most recent Electric Power Monthly update, which provides data through the end of July. The report notes that for the month, solar photovoltaic generation (solar1) as a portion of all...
The US Department of Energy’s Energy Information Administration (EIA) released its most recent Electric Power Monthly update, which provides data through the end of June. The report notes that for the month, solar photovoltaic generation (solar1) as a portion of all...
The US Department of Energy’s Energy Information Administration (EIA) released its most recent Electric Power Monthly update, which provides data through the end of May. The report notes that for the month, solar photovoltaic generation (solar1) as a portion of all...
New Solar Development Training by PV Intel teaches users how to develop community scale solar projects. The United States is projected to double the total amount of installed solar PV by the end of 2025. Annual deployments are growing by over 500% and will reach 100...
This table represents the top 25 largest solar projects in the United States in terms of nameplate capacity (MW), as reportedby the Energy Information Administration. Projects must have received regulatory approval, but not yet achieved commercial operation date. A...
Solar InSight / The Latest Solar News from PV Intel
Residential solar offers price certainty in chaotic electricity markets
Experts say Texas’ electric rates have nearly doubled in a year, as peak demand challenges natural gas supply. Residential solar is an alternative that offers clarity in the future of electric bills.
Guzman Labs
In Texas, electricity is deregulated, which means distribution-level energy supply companies can compete in the open market to offer residential and commercial contracts. Texans are now accustomed to shopping around for new electric rates every six to twelve months or so to choose who will deliver power and select a contract that works for them.
While deregulation has initially led to lower electricity prices in the state, it comes with some issues of complexity and transparency. These issues may be negatively impacting the long-term outlook for reasonably-priced and reliable electricity for Texans in the long term.
Complexity
Electricity rates are “decoupled” in Texas, meaning generation from power plants and transmission from the grid are two separate costs on a utility bill from separate companies. In the Texas deregulated market, customers have choice over who provides the generation, but not the transmission. Customers choose their electric rate packages from Retail Electric Providers (REPs).
REPs offer contracts to Texans in a fashion very similar to a cable contract, where there is often a “teaser” electric rate that starts the customer off at a low, attractive rate, and then increases sharply months later. Typically, a customer signs a contract that ranges between six months to three years. There are often cancellation fees exceeding $250, so it can be costly to change providers when that teaser rate period ends.
There are also a lot of complexities hidden in the fine print of these contracts. For example, shopping for an electric rate contract in Dallas, Texas, at the time of writing, the “lowest” available contract on Choose Texas Power, a rate shopping platform, is from REP Frontier Utilities. The rate is listed at $.0132/kWh at 1000 kWh.
However, the fine print of the contract reveals that the first 500 kWh used each month, a significant portion of a home’s monthly usage, is charged nearly double that posted rate at an average of $0.236/kWh. The next 500 kWh are charged an average $.132/kWh, and any usage exceeding 2000kWh is charged an average of $.181/kWh.
The true charge, looking over the standardized Electricity Facts Label, is $0.19/kWh, or 44% higher than the advertised sticker price. Plus, there is a $200 cancellation fee, and additional charges from utility TDU of $.038/kWh, and a $3.47 fixed delivery charge.
This example is representative of many in the Texas energy supplier market, and it creates a real opportunity cost for residents. The time spent sifting through the fine print of these contracts to save on monthly bills is valuable time lost.
Predatory contracts
The deregulated market also opens the door for predatory contracts to be signed, which disproportionately affect low-income community members. Currently, Massachusetts is proposing legislation to eliminate competitive electric suppliers, citing problems with predatory contracts.
This problem was highlighted by the Winter Storm Uri in February 2021, which caused massive spikes in unexpected electricity demand and froze some natural gas peak demand plants. The storm led to widespread shortages, rolling blackouts, and wholesale market prices exploded to the legal cap of $9/kWh for several days. This was a 7,400% increase over the average rate at the time of about 12 cents /kWh.
Some customers who signed predatory contracts were exposed directly to wholesale prices. Following the storm, Chambers County resident Lisa Khoury received a bill from supply company Griddy for $9,340. Her normal bills ranged $200 to $250 a month. Griddy drafted payments from Khoury’s bank several times, pulling $1200 before she blocked further charges from the bank.
Khoury still owed Griddy for the rest of the bill when she decided to enter a class action lawsuit against the company, seeking $1 billion in relief for affected customers.
Prices rising, reliability lowering
David Kinchen, chief operating officer for Energy Ogre, is close to the issue, as his company charges residential customers $10 a month to shop for competitive REP contracts, sifting through the fine print and predatory contracts to find reasonable rates. Kinchen said prices have gone up sharply, nearly doubling since last year.
“The direct correlation is natural gas setting that marginal price unit and causing prices to double,” said Kinchen. “Say we get to an event and we need large amounts of natural gas. We can only pull so much out of production. A lot of that has to come out of storage. As you can imagine, when you get to these very brief periods of high demand, having that sitting there in storage ready to go has a lot of value. When that number’s not sitting there in storage, it has to come out of production.”
As the south and west portions of the US are hit with an early heat wave this June, demand, and therefore prices, are already spiking, at a time where Americans are already dealing with steep inflation and high gas prices. Kinchen said there may be relief in the next eight to ten months, but this is uncertain, as gas prices can be tied to geopolitical events.
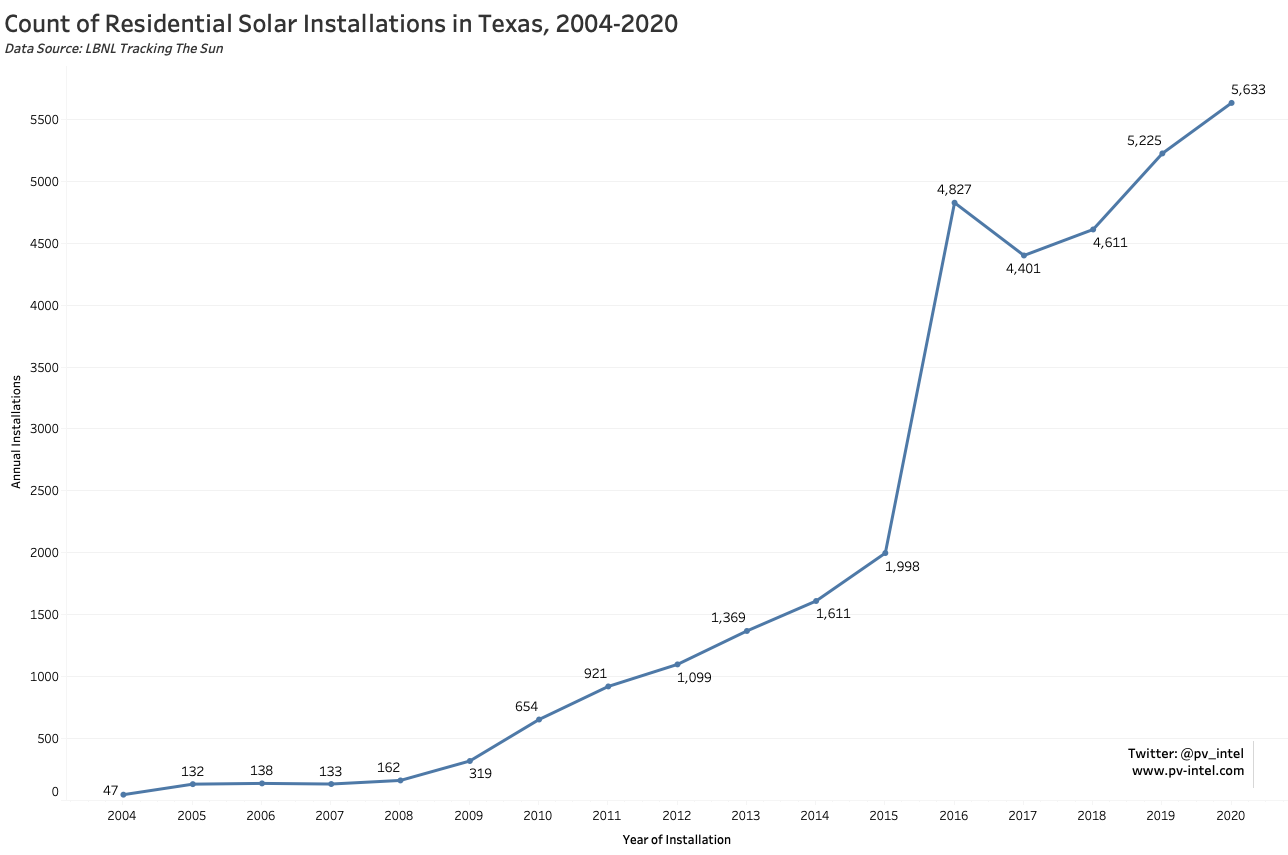
As electricity prices rise and reliability falls, solar installations are on the rise in Texas. Image: PV intel
Reliability is a growing concern, too. Demand hit a seasonal record of 69,150 MW during the winter storm, and the Texas grid did not have enough reserve power to deliver, leading to widespread blackouts.
The problem lies in deregulated markets, as Utility Dive editor Paul Griffin wrote, “The power system in Texas wasn’t really designed to deliver power to customers. It was designed to deliver revenue to the patchwork quilt of companies that choose to participate in its marketplace. Companies that could disappear in a year. Companies that collect bills from customers, but have no obligation to restore downed power lines, because someone else owns them.”
Griffin said this model opens the door for energy producers and suppliers to cut corners, like not winterizing equipment or running proper reliability tests for reserve power.
The winter storm Uri was described as a “tail event,” but extreme weather is becoming increasingly common. At the RE+ conference in San Antonio, Solar Energy Industries Association (SEIA) president and CEO Abigail Ross Hopper said, “The past as a model for the future is not true anymore. One hundred-year storms occur every five years. What is normal? What is baseline?”
The panel Hopper led at RE+ on the ERCOT grid shared that 40,000 power outage events occurred in the US last year. That is a 50% year-over-year increase over 2020. As electrification of homes and vehicles continues, demand will only increase, putting greater strain on the grid and on residents’ wallets.
Solar for clarity
In this web of complexity, residential rooftop solar can offer some clarity to Texas homeowners. Even if the system cannot meet 100% of a home’s energy needs, the demand that is supplied by solar will provide a clear, transparent look ahead for the next 20-25 years of electricity bills. There are no re-negotiations every several months, and on day one a customer is shown the exact amount of what they will pay for their system for the entirety of the contract.
As Kinchen noted, rates have nearly doubled since summer of 2021. Where will ERCOT rates be in 25 years?
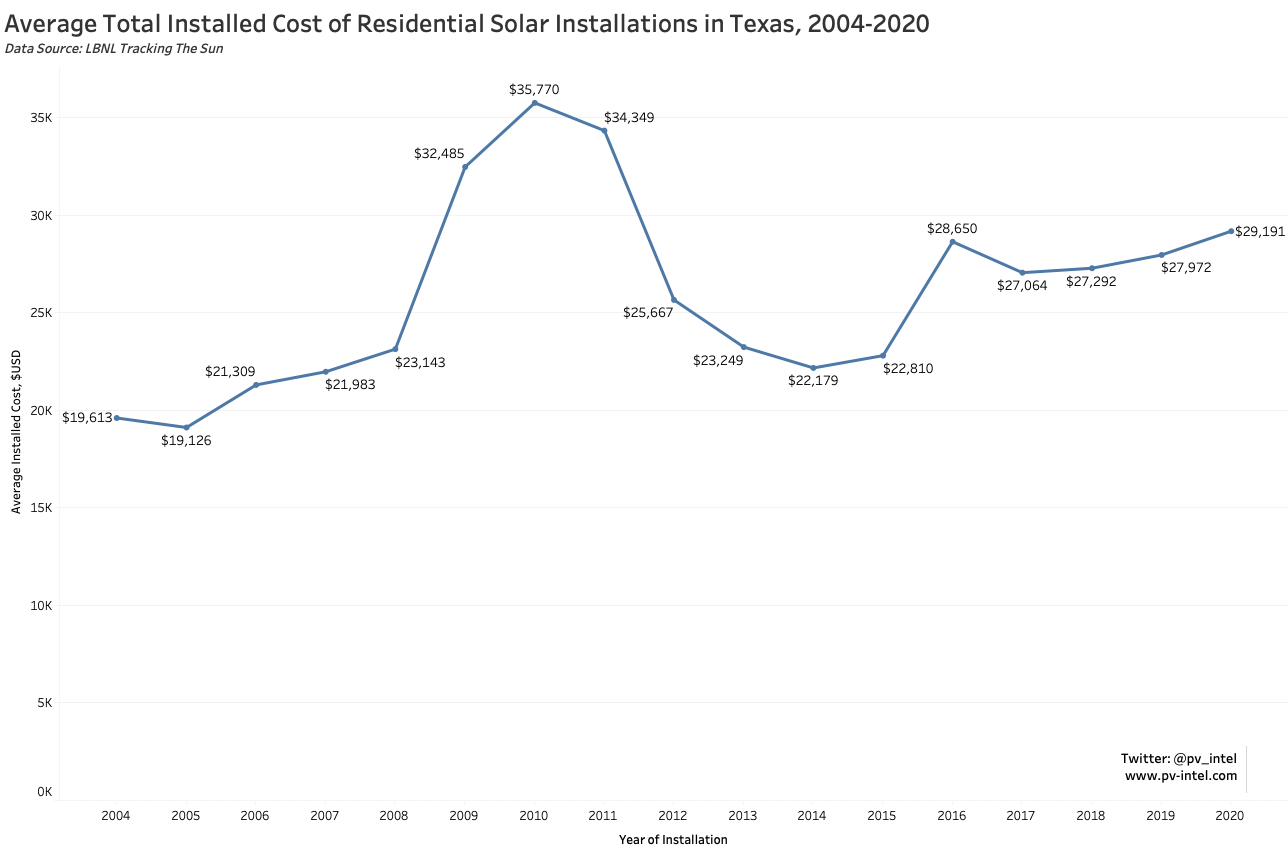
The cost of solar has stayed relatively flat in recent years, suggesting that waiting to go solar doesn’t pay. Image: PV intel
Historically, people have benefitted from adopting solar early, but savings can vary based on the suitability of the roof, the energy needs of the home, and other factors. Homeowners interested in solar should gather at least three customized quotes that are designed for their needs to understand the opportunity available. EnergySage and SolarReviews’ Solar Calculator can be a good place to begin your research.
As an example, we return to the “lowest” available contract on the REP shopping website from Frontier Utilities. At an average rate of $.19/kWh for 1000kWh, that is $190 per month. Add in the TDU energy charges and the rate is $.228/kWh and a monthly bill of $228. Paid 12 months of the year for 25 years, and the total cost of power would be $68,400.
Based on an average solar irradiance during peak sun hours of 4 kWh/m2/day, this same energy usage of 1000kWh a month would need an 8 kW system to meet its needs. Many locations in Texas receive significantly more sunlight than this example.
According to EnergySage, an 8kW solar system averages $15,925 after incentives in Texas. Financing rates often range from 3% to 7% for an array. Assuming the highest incentive rate of 7%, loan payments would average $112 per month, and the total amount paid over the 25 years would be $33,768.
So, assuming that grid rates stay flat for 25 years, staying with the status quo would cost $68,400, while paying for a solar array that produces the same 1,000 kWh a month would cost $33,768 under highly conservative assumptions.
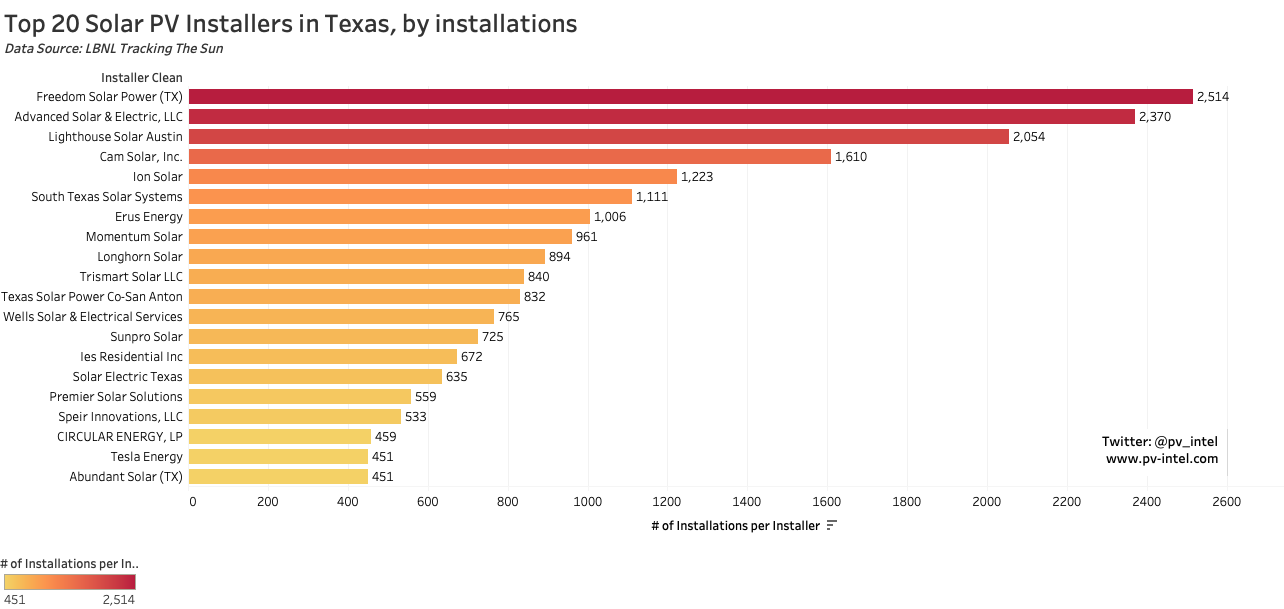
The top 20 installers have performed about two-thirds of residential solar installations in Texas. Image: PV intel
It’s safe to say that electricity rates will continue to follow historical trends and rise in the future, so securing a rate for long-term clarity may be one of the best reasons to install residential solar.
In the next edition of this series, pv magazine will follow up with analysis of solar and battery storage, and how the technologies benefit both homeowners and the grid at large.
Jason O’Leary, Principal Analyst at pv-intel.com, contributed to this article with data analysis and data visualization.
Solar InSight
Solar InSight brings you the latest and most important solar industry news with unique perspective and in-depth analysis by PV Intel.
The US Department of Energy’s Energy Information Administration (EIA) released its most recent Electric Power Monthly update, which provides data through the end of July. The report notes that for the month, solar photovoltaic generation (solar1) as a portion of all...
The US Department of Energy’s Energy Information Administration (EIA) released its most recent Electric Power Monthly update, which provides data through the end of June. The report notes that for the month, solar photovoltaic generation (solar1) as a portion of all...
The US Department of Energy’s Energy Information Administration (EIA) released its most recent Electric Power Monthly update, which provides data through the end of May. The report notes that for the month, solar photovoltaic generation (solar1) as a portion of all...
New Solar Development Training by PV Intel teaches users how to develop community scale solar projects. The United States is projected to double the total amount of installed solar PV by the end of 2025. Annual deployments are growing by over 500% and will reach 100...
This table represents the top 25 largest solar projects in the United States in terms of nameplate capacity (MW), as reportedby the Energy Information Administration. Projects must have received regulatory approval, but not yet achieved commercial operation date. A...