The US Department of Energy’s Energy Information Administration (EIA) released its most recent Electric Power Monthly update, which provides data through the end of July. The report notes that for the month, solar photovoltaic generation (solar1) as a portion of all...
The US Department of Energy’s Energy Information Administration (EIA) released its most recent Electric Power Monthly update, which provides data through the end of June. The report notes that for the month, solar photovoltaic generation (solar1) as a portion of all...
The US Department of Energy’s Energy Information Administration (EIA) released its most recent Electric Power Monthly update, which provides data through the end of May. The report notes that for the month, solar photovoltaic generation (solar1) as a portion of all...
New Solar Development Training by PV Intel teaches users how to develop community scale solar projects. The United States is projected to double the total amount of installed solar PV by the end of 2025. Annual deployments are growing by over 500% and will reach 100...
This table represents the top 25 largest solar projects in the United States in terms of nameplate capacity (MW), as reportedby the Energy Information Administration. Projects must have received regulatory approval, but not yet achieved commercial operation date. A...
Solar InSight / The Latest Solar News from PV Intel
Solar generation up 36% in the first two months of 2022
pv magazine examines the growth of solar in the early months of this year, and takes a look at its sustainable energy counterpart, wind energy.
Guzman Labs
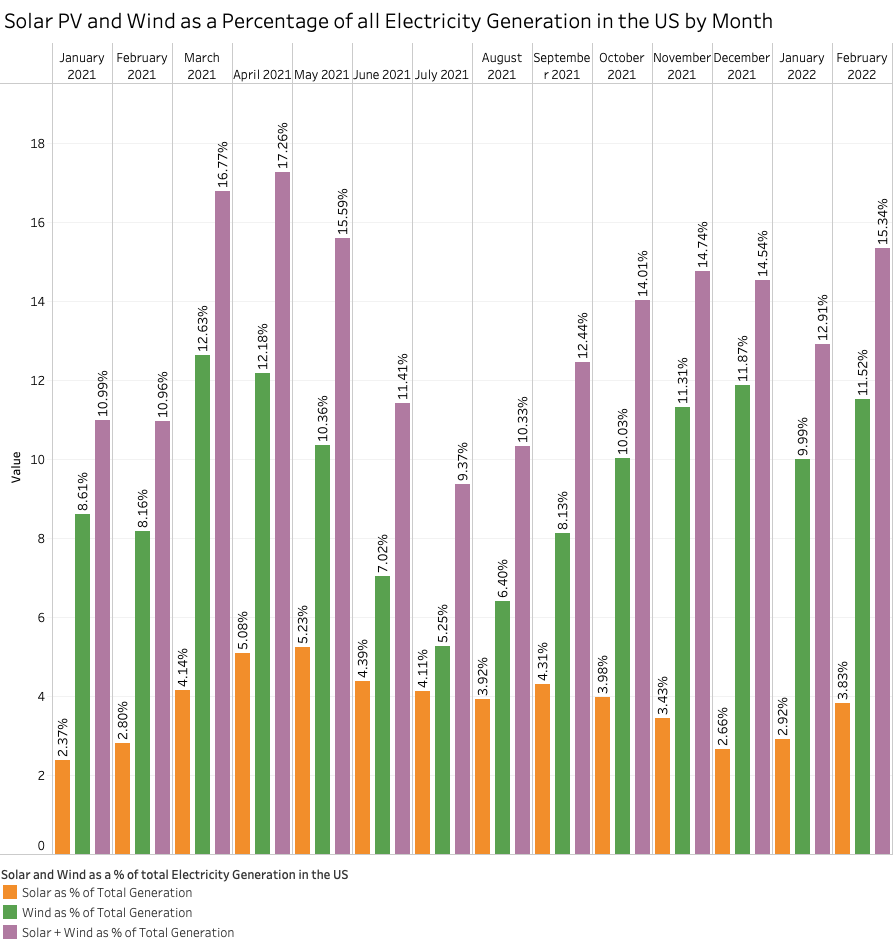
The solar PV train has left the station with strong momentum in 2022, showing 36% year-over-year growth through February when compared to the first two months of 2021. This marks significant growth despite a year of challenges for the industry. This figure includes both large-scale and small-scale generation, as reported by the Energy Information Association (EIA) Electric Power Monthly, which shows updated capacity and generation data through February 2022.
Through the first two months of the year, all solar PV generation reported by EIA combined for 23,862 GWh, up from 17,593 GWh through the first two months of 2021.
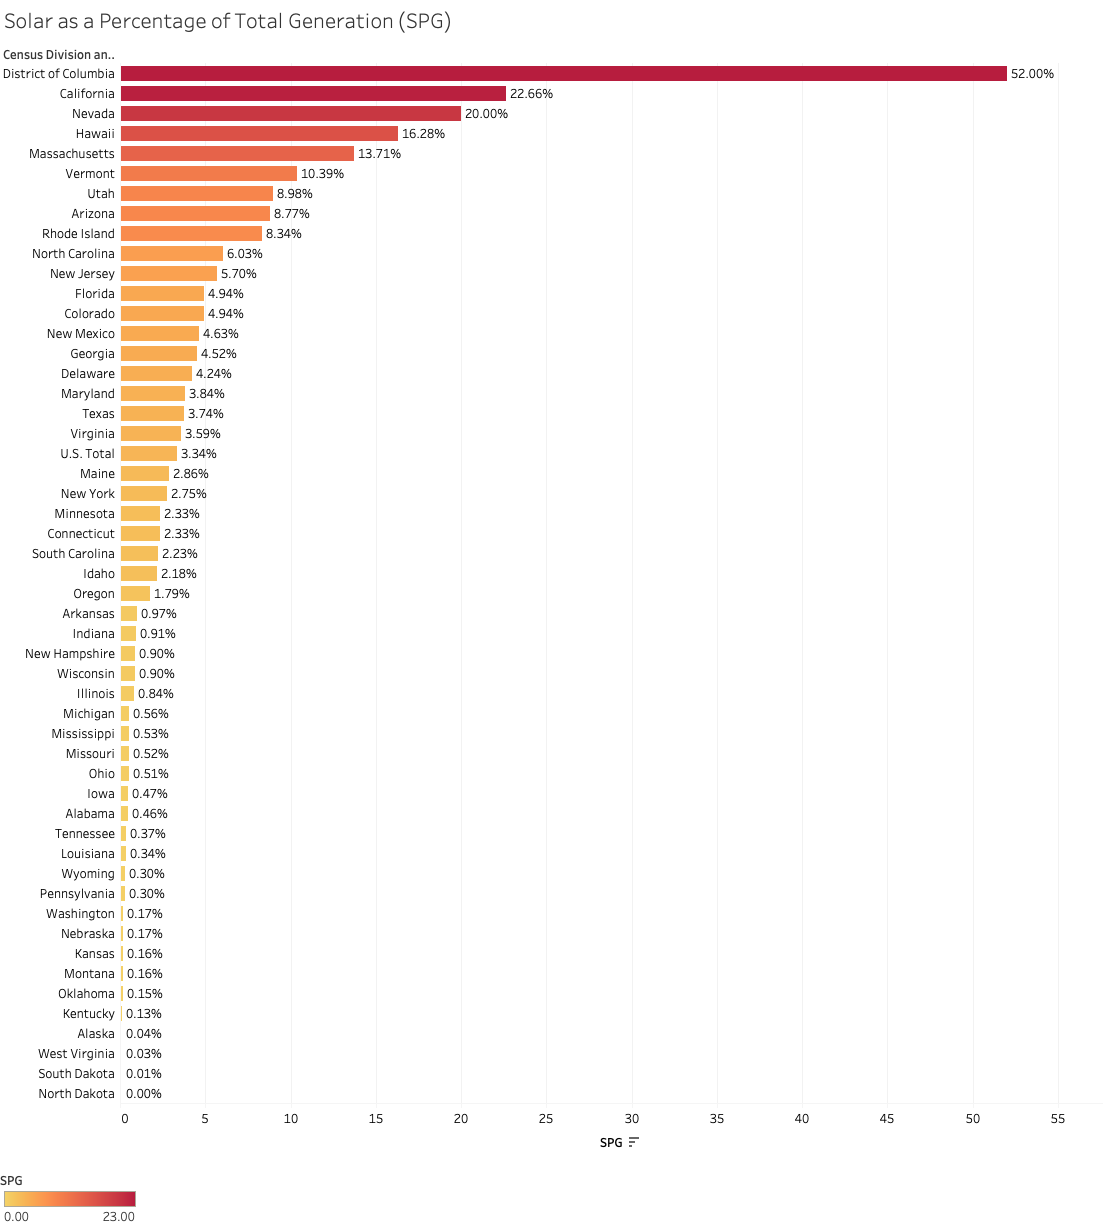
As a portion of all electrical generation, all solar PV reported by EIA generated 167,047 GWh on a 12-month rolling basis through February, just under 4% of total generation in the United States. This compares to the 12-month rolling basis a year before, in which solar PV generated 130,511 GWh, a 3.24% share in US electricity generation.
Image: PV intel
This boost in generation is thanks to the hard work of the US solar industry, which together installed 23.6 GW of capacity in 2021, enough to power the equivalent of 23.3 million American homes, according to the Solar Energy Industries Association (SEIA). Solar accounted for 46% of all new capacity brought online in 2021, marking the third year in a row that PV held the largest share of new capacity additions in the US.
Small-scale generation projects, which are projects less than 1 MW, were estimated to provide 50,301 GWh on a 12-month rolling basis, up 19% from the previous year’s rolling 12-month generation of 42,257 GWh. This level of generation means that small-scale solar projects have now eclipsed 1% of total generation throughout the year at 1.2%.
Sustainable energy
In a previous look at EIA figures, pv magazine reviewed differences between “renewable” and “sustainable” energy. Johns Hopkins University describes renewable energy as something that comes from sources that naturally renew themselves to meet our energy needs. This can include such technologies as biomass, hydropower, etc. “Sustainable” energy is defined as energy that can support both the current generation as well as future generations. John Hopkins considers solar and wind as primary sources of sustainable energy.
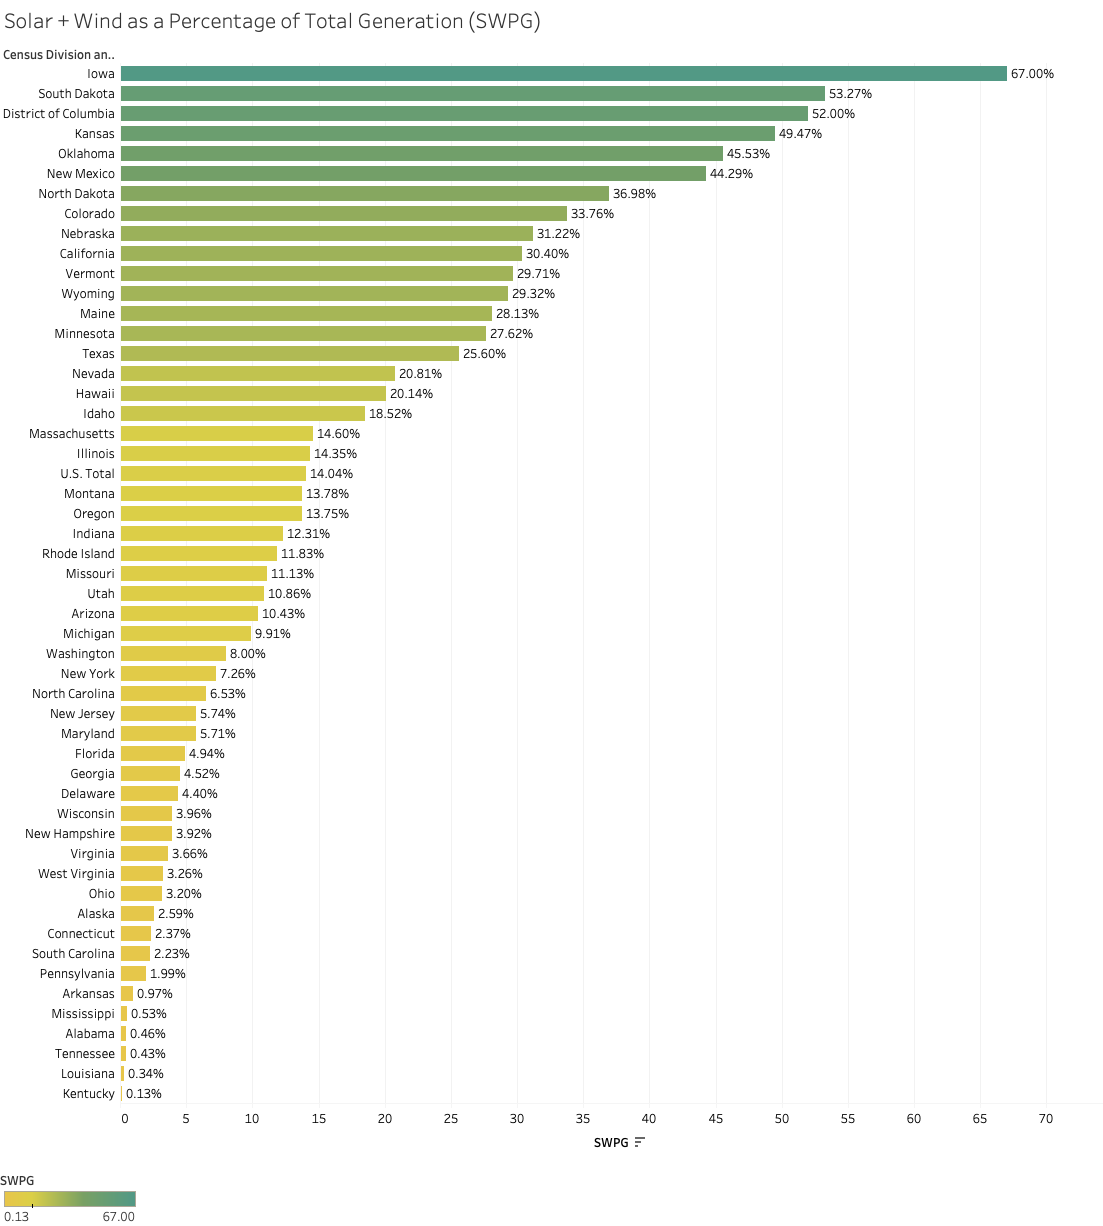
Sustainable electricity generation (all solar PV and wind) started 2022 strong, growing by greater than 33% through two months versus the prior year.
Image: PV intel
Solar and wind generation totaled 616,149 GWh on a 12-month rolling basis. Year-to-date through the available February data, solar and wind have combined for 107,164 GWh, a 15% share in the US electricity supply thus far in 2022. Last year, sustainable electricity held an 11.8% share through the first two months of 2021.
We are eager to analyze the figures for this spring, where demand lowers and solar production ramps up, and it will be interesting to see the PV total share of electric generation, with CO2 free generation (including nuclear and hydropower) possibly reaching 50%. Emissions-free generation peaked in May of 2020 and then March of 2021, contributing 46.5% and 45.8%, respectively.
Dips in nuclear and hydropower contribution, which are expected to continue, contributed to a smaller share of electricity generation being emissions free in 2021 vs. 2020, suggesting that solar PV and wind will need to deploy even more rapidly to carry the torch for climate friendly energy generation.
Image: PV intel
Recently, California celebrated a milestone where 101% of real-time demand was matched with renewable energy generation for about fifteen minutes on a sunny Saturday afternoon. While there were still other sources of energy powering the grid at the time, including natural gas and nuclear power, the milestone was a glimpse into the future of the renewably powered economy the state has mandated.
“Twenty years ago no one thought we could get to 100% renewable energy. But bit by bit, bill by bill, and solar panel by solar panel we did it,” said Dan Jacobson, senior advisor to Environment California.
Solar to exceed wind capacity in 2023
Based on the EIA short term outlook for deployment, 2023 may be the year solar PV capacity surpasses wind.
EIA reports a net capacity of 95 GW of solar and 133 GW of wind as of February 2022. Through 2023, EIA expects 10 GW of small-scale solar with 44 GW of utility-scale solar, and 14 GW of wind. This means by year’s end 2023, solar would reach 149 GW installed capacity, and wind would achieve 147 GW.
However, capacity doesn’t tell the whole story. Capacity factor, or how often the plant is actually generating versus its total theoretical capacity, is significantly higher with wind energy than with solar PV.
In 2021, wind capacity factor averaged 34.6% while for solar PV it was an average of 24.6%. Adjusted for capacity factor, solar would still be about 37% behind wind energy’s contribution at the end of 2023. This is a step ahead of today’s generation numbers, where solar currently provided about 58% less electricity than wind on a rolling 12- month basis.
Additionally, renewable energy, including solar, wind, biomass, hydropower, etc., has left nuclear generation in the dust, providing 23% more output over this period, and is widening the gap above coal generation, now providing 2.9% more power. Coal is a rapidly declining energy source, and FERC queues suggest it will continue to fall from about 18% of capacity today to about 15% by 2025.
Solar and wind will have a lot of work to do over the next decade to make up for retired fossil fuels and to support increasing demand. Electrification of buildings, especially heating and cooling systems, and of transportation from the EV revolution will further drive demand. In the next installment of EIA data breakdown, pv magazine will explore the decline of hydropower and nuclear power generation, and how more sustainable energy generation will need to take its place.
Jason O’Leary, Principal Analyst at pv-intel.com, contributed to this article with data analysis and data visualization.
Solar InSight
Solar InSight brings you the latest and most important solar industry news with unique perspective and in-depth analysis by PV Intel.
The US Department of Energy’s Energy Information Administration (EIA) released its most recent Electric Power Monthly update, which provides data through the end of July. The report notes that for the month, solar photovoltaic generation (solar1) as a portion of all...
The US Department of Energy’s Energy Information Administration (EIA) released its most recent Electric Power Monthly update, which provides data through the end of June. The report notes that for the month, solar photovoltaic generation (solar1) as a portion of all...
The US Department of Energy’s Energy Information Administration (EIA) released its most recent Electric Power Monthly update, which provides data through the end of May. The report notes that for the month, solar photovoltaic generation (solar1) as a portion of all...
New Solar Development Training by PV Intel teaches users how to develop community scale solar projects. The United States is projected to double the total amount of installed solar PV by the end of 2025. Annual deployments are growing by over 500% and will reach 100...
This table represents the top 25 largest solar projects in the United States in terms of nameplate capacity (MW), as reportedby the Energy Information Administration. Projects must have received regulatory approval, but not yet achieved commercial operation date. A...