The US Department of Energy’s Energy Information Administration (EIA) released its most recent Electric Power Monthly update, which provides data through the end of July. The report notes that for the month, solar photovoltaic generation (solar1) as a portion of all...
The US Department of Energy’s Energy Information Administration (EIA) released its most recent Electric Power Monthly update, which provides data through the end of June. The report notes that for the month, solar photovoltaic generation (solar1) as a portion of all...
The US Department of Energy’s Energy Information Administration (EIA) released its most recent Electric Power Monthly update, which provides data through the end of May. The report notes that for the month, solar photovoltaic generation (solar1) as a portion of all...
New Solar Development Training by PV Intel teaches users how to develop community scale solar projects. The United States is projected to double the total amount of installed solar PV by the end of 2025. Annual deployments are growing by over 500% and will reach 100...
This table represents the top 25 largest solar projects in the United States in terms of nameplate capacity (MW), as reportedby the Energy Information Administration. Projects must have received regulatory approval, but not yet achieved commercial operation date. A...
Solar InSight / The Latest Solar News from PV Intel
Solar Tsunami: Solar PV grows 26% again – stays exponential as it blows past 4% of US electricity in 2021
Solar continues its march to take over the US electricity system, as five states meet more than 10% of in-state demand with solar PV, while another six states more than doubled their solar generation.
Guzman Labs
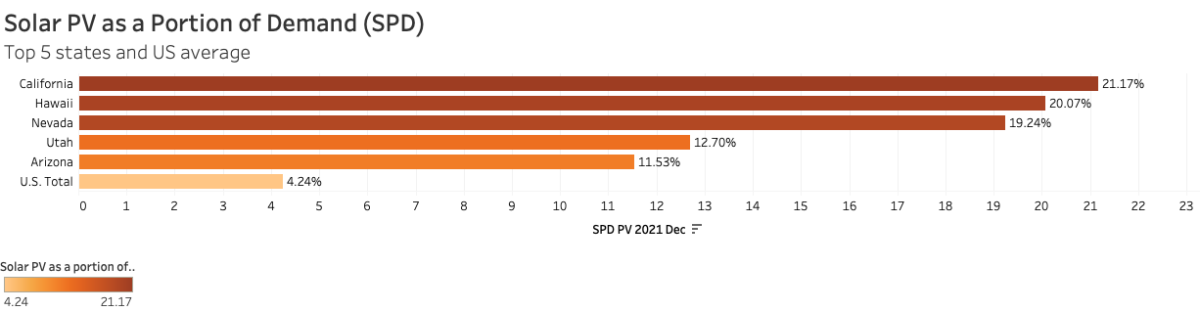
Solar photovoltaics represented over 4% of the electricity generated in the United States in 2021, according to the latest data from the U.S. Department of Energy’s Energy Information Administration (EIA). The February 2022 edition of the EIA’s Electric Power Monthly shows the electrons set loose by solar panels growing 26% during the year, following on similar growth in the previous year.
But this growth, and the contribution of solar to the electricity system, is highly uneven from state to state. While some states have very little solar (cough—the Dakotas—cough), California got a whopping 21% of its power from photovoltaics (PV) installed in the state over the course of the year, while Hawaii got 20% and Nevada 19% of their power from in-state solar. In fact, a total of five states got 10% or more of their electricity from solar in 2021, with PV meeting 12% of demand in Utah and 11% in Arizona.
One quick note: this year we are back to looking at solar in each state in relation to the state’s electricity demand, not of electricity generation in-state. We’re doing this because some states, like Massachusetts and Vermont, import a lot of power from across state lines. Therefore looking only at their in-state generation paints a somewhat distorted picture of the progress of solar in those states. Our assumptions also include that solar generated in a given state meets electric demand in that state.
Speaking of New England, one state east of the Rocky Mountains is on the cusp of 10%: Rhode Island.
Wait—did you say Rhode Island? Yes. After several years of dramatic growth, with output from solar doubling year over year from 2018 to 2019 and again from 2019 to 2020, Ocean State solar output grew another 45% this year to come in at 9.78% of demand. Next year, it will inevitably be the first state East of the Rocky Mountains to cross the 10% barrier.
Bristol County, Rhode Island Solar Installation, 249.9 kWdc rooftop installation
Notably, Rhode Island got more than half of its generation from “small-scale solar,” which is defined by EIA as projects smaller than 1MWac. That’s a lot of old mill buildings & malls with solar on their roofs—and a lot of homes.
There are other regional exceptions as well. North Carolina got 7.6% of its electricity from in-state solar in 2021, as the leading state in the South. Unlike Rhode Island this was nearly all from large-scale solar power plants in the 5–20MW range, much of it from a boom several years ago driven by state implementation of PURPA.
But with high penetrations come new challenges—like California’s duck curve, and the collapse of mid-day power prices. It is no accident that more than 90% of the solar projects in the interconnection queue of California’s grid operator include battery storage. And the duck curve is already showing up some days in New England.
Big growth in small markets
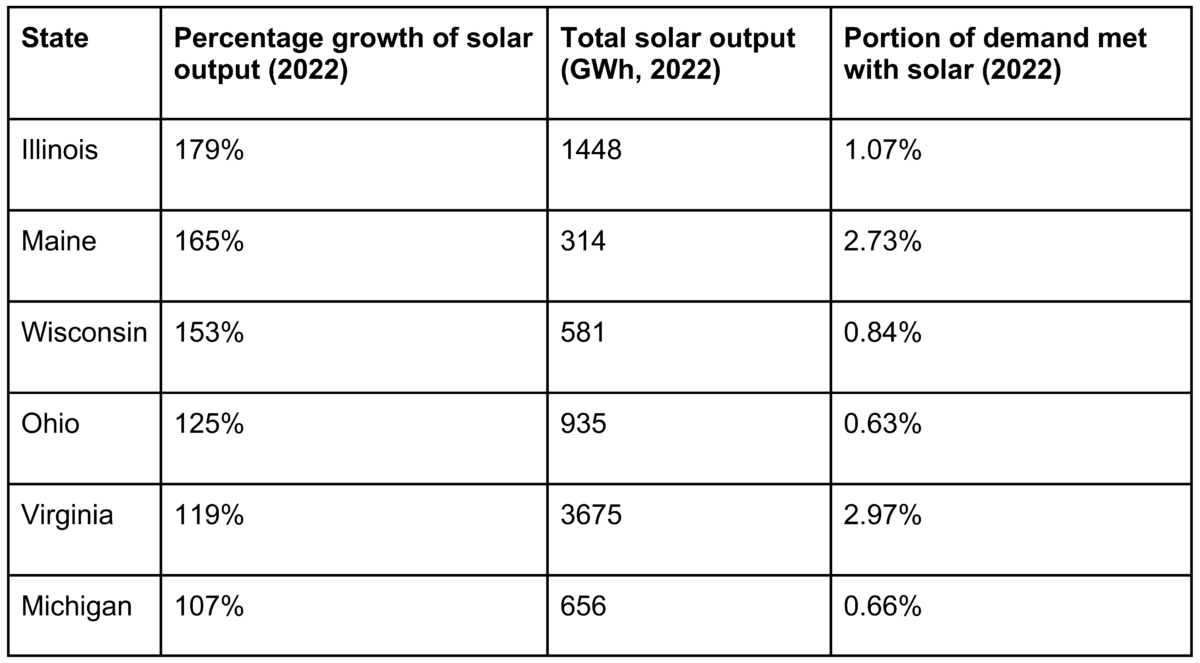
Solar is also growing quickly in a number of smaller markets. Six states in the Midwest and Atlantic Coast showed triple-digit growth, with output from solar more than doubling in Illinois, Maine, Michigan, Ohio, Virginia, and Wisconsin.
These are all relatively nascent markets—in Maine and Virginia solar meets around 2.7%–2.9% of demand, and in most other states less than 2%. However, they are growing much faster than larger markets; in 2020 Texas’ solar output grew 61% and California’s only 15%.
Four of the states with fast-growing solar are in the Upper Midwest, an area that is split between the PJM Interconnection and MISO grids. As reported in our Solar Tsunami 2022article last month, both of these grid operators have enormous volumes of solar projects in their queues; 87 GWac in MISO and 188 GWac in PJM.
All of this suggests that large-scale solar is poised to take off in the Midwest in the next few years. But while the recent reforms to MISO’s interconnection queue are promising, PJM Interconnection’s request to freeze new requests while it works through its queue are more troubling. In future articles PV Intel will have more to say about the growth of large-scale solar in the Midwest, as well as the accelerating growth of solar over time.
While 4.24% of power shows tremendous progress over the past few years, solar is not stopping there. EIA expects the United States to install 21.5 GWac of solar this year. Even with the projects already under construction we can expect another big increase in electricity from solar this year, and again next year, as part of renewable energy displacing fossil fuels to take over the U.S. power system.
A note: PV Intel, in our drive to make the most accurate and sharpest data available, has begun to analyze solar generation in a more finely tuned manner. For instance, we’ve begun to consider the fact that onsite or near site distributed solar power does not suffer from the same line losses that occur with all other large- scale energy sources. The EIA and other groups put these losses in the high single digit range.
See you next month!
Jason O’Leary, Principal Analyst at pv-intel.com, contributed to this article with data analysis and data visualization.
Solar InSight
Solar InSight brings you the latest and most important solar industry news with unique perspective and in-depth analysis by PV Intel.
The US Department of Energy’s Energy Information Administration (EIA) released its most recent Electric Power Monthly update, which provides data through the end of July. The report notes that for the month, solar photovoltaic generation (solar1) as a portion of all...
The US Department of Energy’s Energy Information Administration (EIA) released its most recent Electric Power Monthly update, which provides data through the end of June. The report notes that for the month, solar photovoltaic generation (solar1) as a portion of all...
The US Department of Energy’s Energy Information Administration (EIA) released its most recent Electric Power Monthly update, which provides data through the end of May. The report notes that for the month, solar photovoltaic generation (solar1) as a portion of all...
New Solar Development Training by PV Intel teaches users how to develop community scale solar projects. The United States is projected to double the total amount of installed solar PV by the end of 2025. Annual deployments are growing by over 500% and will reach 100...
This table represents the top 25 largest solar projects in the United States in terms of nameplate capacity (MW), as reportedby the Energy Information Administration. Projects must have received regulatory approval, but not yet achieved commercial operation date. A...